Forum Discussion

mnagel's avatar
mnagel
Icon for Professor rankProfessor
9 years ago

custom speed for interfaces

In some cases, it is important to be able to alter the speed of an interface (speed up or down or both) to accurately reflect the connected device speed (which itself may be opaque, like a cable modem that runs at 20/1 on a gigabit port).  I asked this a while back from TS and was told "just change the interface", but when I explained how this is not always feasible (e.g., Cisco ASA), they recommended I open a feature request.  So, here it is -- I would like to be able to set speed up and speed down on an interface, overriding what comes back from ifSpeed.  If I can do this another way (via cloned DS) ,that could work, but I would like to make this as simple as possible since it comes up quite a lot for Internet-edge equipment.

Thanks,

Mark


  • Hey - I took the liberty at looking at the logs for your account -looks like you didn't actually import the new datasource version. (Which our UI makes easy to do... something we're fixing.)

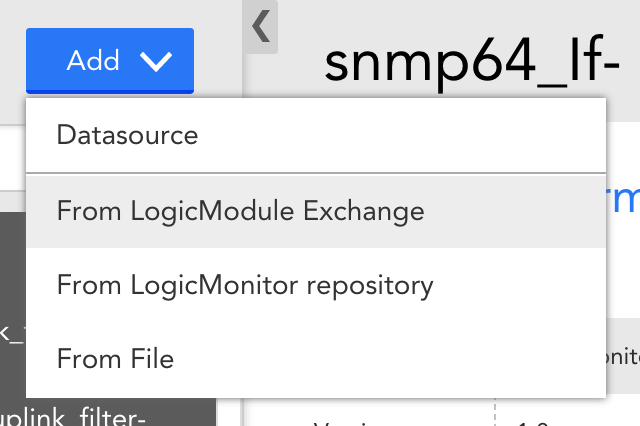
    You want to make sure you import from the Exchange, not the repository, then give it the locator code RMP2DL


    This is a slightly updated version of the one I mention above - a few efficiency improvements in the code.

    The only substantive change is the filter property to filter in interfaces by description has been changed to the property interface.description.alert_enable

    as its a bit more descriptive.

    The bandwidth properties are still ActualSpeed and ActualSpeedUpstream.


    Let me know if you have any issues.

  • This is very nice, and it also solves the issue of not alarming when the interface is admin down.  Can I make a suggestion of not calling the Operational Status "StatusRaw" and just using OperState (similar to AdminState)?

    When will this be deployed to core?

  • 2 minutes ago, Jamie said:

    This is very nice, and it also solves the issue of not alarming when the interface is admin down.  Can I make a suggestion of not calling the Operational Status "StatusRaw" and just using OperState (similar to AdminState)?

    When will this be deployed to core?

    I had to solve this in one portal by creating a complex datapoint in the original DS (I still need to take a look at the revised DS in this thread).  Getting that combined state is harder than you might expect because of a silly design flaw in the DP expression language -- there is neither a 'not' operator nor a 'neq' operator.  So in mine, to know that something is admin up and oper "not up", I have 'ActualStatus' calculated as "and(eq(AdminStatus,1),eq(Status,2))" instead of the more correct "and(eq(AdminStatus,1),neq(Status,1))". Simple to fix in the language interpreter I am sure, but I am not holding my breath.  The one I did works well enough, though, so I can get reliable alerts for unexpected ports down on core devices.

  • I was using a complex datapoint (formula) as well, essentially checking if adminstate = 1, if true then using that as a multiplier against operstate and carrying that value through.  If false, I was instead using 0 as the multiplier and alarming on anything greater than 1.  A bit hacked, but effective.

  • It's in core with v102 release. (So next week)

    I renamed the StatusRaw datapoint to OperStatus. (Good idea, thanks.)

    This datasources uses groovy to do the Admin/operational state alerting, as it also does regex matching, so I didn't run into the lack of neq - an oddly never have before.

    I'll open a ticket to get that added..

  • Excellent on the token thing -- looking forward to that!

    What I found when I removed the operStatus AD filter was that a bunch more interfaces reported alarm almost immediately.  I think my script to deactivate alerts would have eventually caught up, but it was super noisy so I quickly reverted.  I need to look at the new way as my method was a necessary evil given the tools available.  I did notice later, though, that failure to update the description for down interfaces made my script less useful than intended.

    Nonunicast is a funny thing.  Acceptable levels tend to vary in different environments (I have seen Nexus 7K cores handle 50000pps without breaking a sweat -- not good, but not deadly to the switch), but there are levels that are absolutely bad in typical environments.  I normally do not set thresholds on percentage as this could trigger for ports with in otherwise inactive hosts seeing not much other than nonunicast traffic.  A rule of thumb is that for access ports, under 200pps can be safely ignored (though it is still high).  Trunk ports will tend to be higher as you will see combined levels for all VLANs on the trunk.  When we see "freak out" levels, they are in the 1000pps or higher range.  Translating to LM-speak, I would start with "> 200 1000 2000" (but again, hard to set just one good threshold).

    On 2/3/2018 at 6:19 PM, Steve Francis said:

    Note: as of v100, Instance level properties now work as tokens in alert messages. Development tells me they did prior to v.100 - which I thought I tested, and found the didn't - but in any case they definitely work in v.100.


    Thanks!  Is the format documented, or is it literally the name within the instance and it is just in scope for the datapoint instance at alert time?  How are clashes with device property names avoided, I guess is my real question...

    @Steve Francis I just noticed something missing in the new datasource that would be useful -- the interface speed is not available as a datapoint (not the actualspeed or actualspeedupstream, but the interface reported speed value).  This is very important to have in some cases where no other method of problem detection exists.  The most common I have run into is MLPPP or MLFR, where no MIB exists to inform you that even though all member ports are up, the bundle is not complete. I often do the same for ethernet aggregates for the same reason.  The test is simple -- verify the bundle speed is the expected speed.  So, I suppose you could add support for ExpectedSpeed ILP and automatic alert, too :).  Graphing the speed over time would allow showing when upgrades happened (as is the case for disk charts).  Question is, should that value be  reported as-is or clamped to the ActualSpeed* values?  Or perhaps both RawSpeed and Speed/SpeedUpstream?

  • So if I understand you correctly - you could get the reported interface speed by adding a complex datapoint (RawSpeed, say) with this value:

    if(lt(##auto.BasicSpeed##,4294967295),##auto.BasicSpeed##/1000000,##auto.Speed##)

    Is that what you mean?

  • 1 minute ago, Steve Francis said:

    So if I understand you correctly - you could get the reported interface speed by adding a complex datapoint (RawSpeed, say) with this value:

    if(lt(##auto.BasicSpeed##,4294967295),##auto.BasicSpeed##/1000000,##auto.Speed##)

    Is that what you mean?

    So -- yes, if you could reference properties in a complex datapoint, that would be awesome.  Is that a new feature?  Last I checked, I had to mirror properties into datapoints so I could use them like that!

  • Just wondering when this feature will be generally applied to the various interface datasources within LogicMonitor?  There are a plethora of interface datasources that do not support this method (e.g., FortiGate interfaces, etc.)